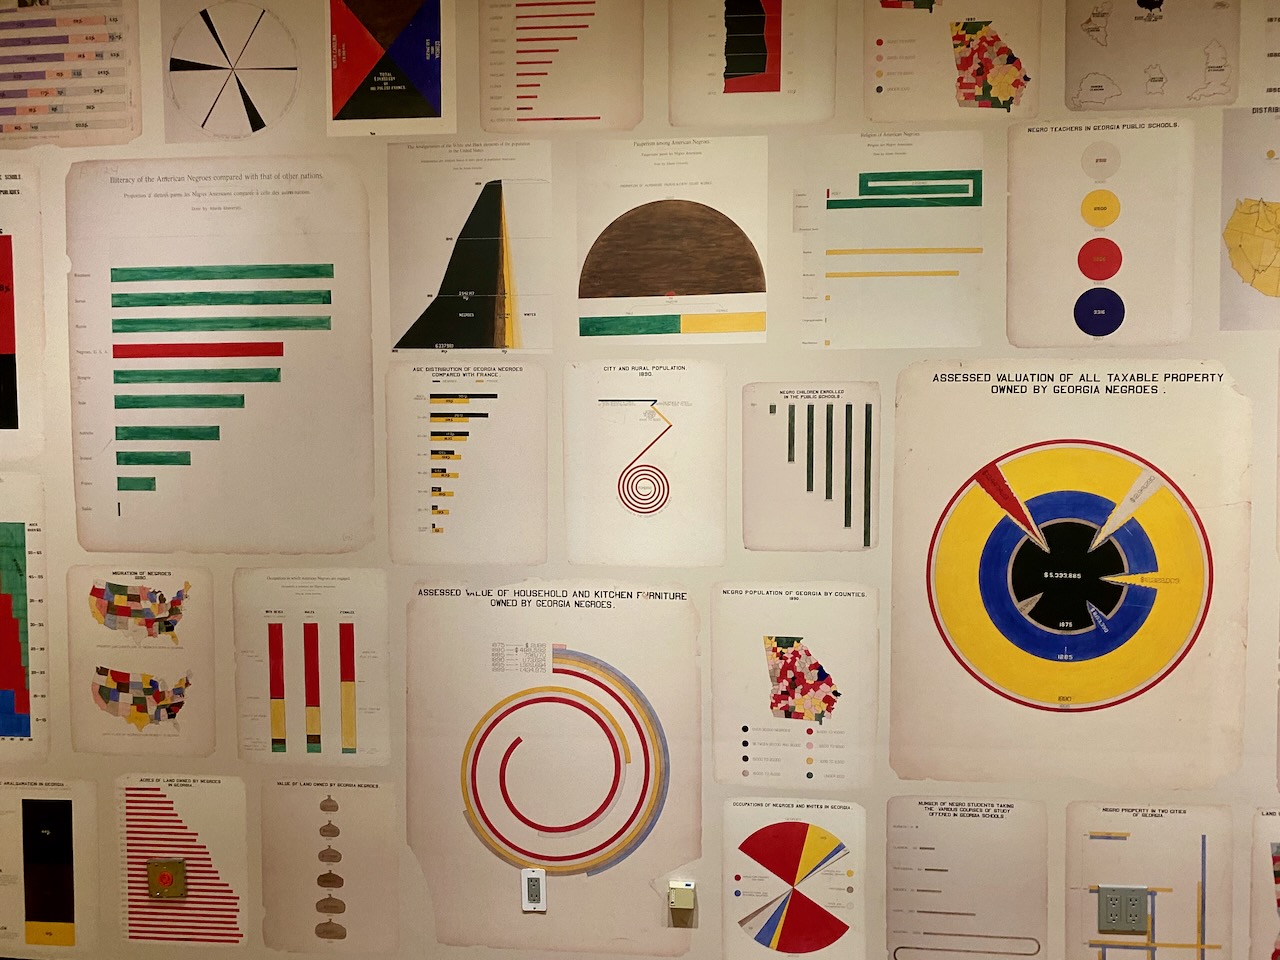
Without context, pie charts, bar graphs, scatterplots, histograms, and gauge charts are more like artwork than representative of data that informs their creation. The challenge to us is to present the graphs with accessible context. There is a story within each, an opportunity to take the viewer on a journey. How might we employ graphs to support our efforts and avoid confusing those looking for meaning?
