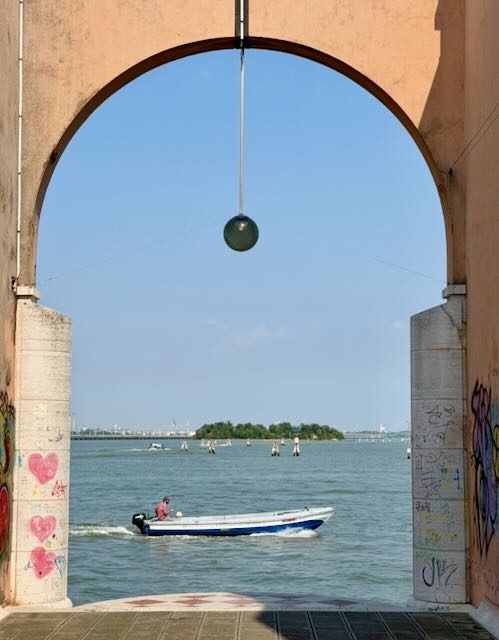
Our journey might benefit from the right framing. If we can provide context for the work we are doing, it might make sense to those looking to follow in our steps.
Our journey might benefit from the right framing. If we can provide context for the work we are doing, it might make sense to those looking to follow in our steps.

We see things as we understand them until we are provided with a unique perspective or context. A pigeon in a city is almost universal. A pigeon statue named Dinosaur on the High Line in New York City takes on a distinct dimension.
How might we provide context for our work? Otherwise, it may be diminished or expanded to the most common form.

What if you read that this year will be the coolest average global temperature in the next century? It is a different spin from the typical statement that the current year is the warmest on record. This perspective has been thoughtfully outlined by John Vaillant in his book Fire Weather: A True Story From A Hotter World.
How might we describe our work so it resonates and provides memorable context?
The preserved parts of our history are like shards of glass, scattered pieces of a vessel that once was a single container. The parts can be assembled to provide a glimpse into the past, but they cannot tell the whole story. What we choose to preserve often leaves many questions. How might we provide context for the time capsules we assemble for those that follow?
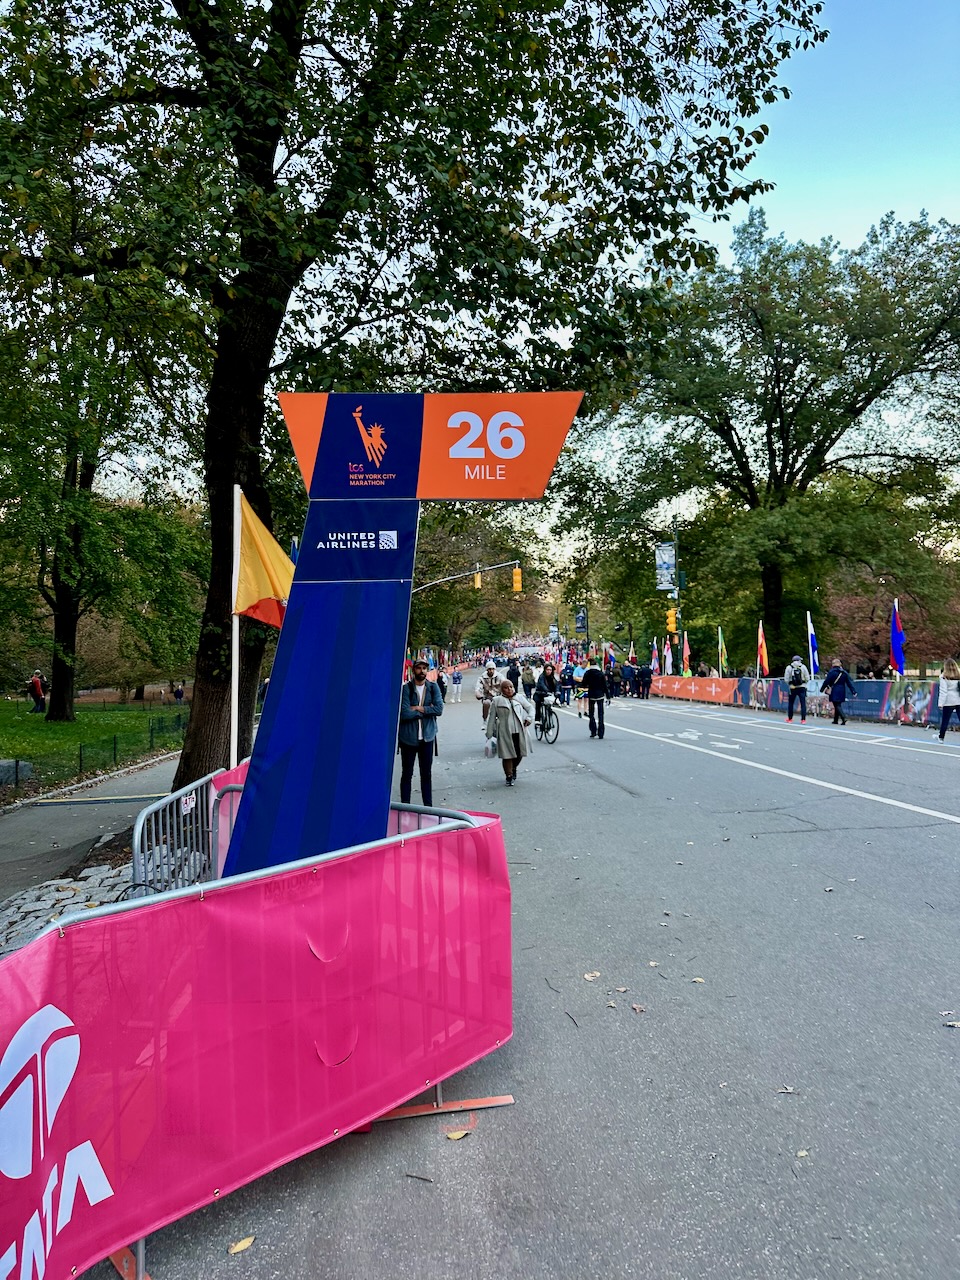
A mile marker by itself is random. The ’26-mile’ mark at the end of a marathon is cause for celebration because it is one of a number in an unfolding journey.
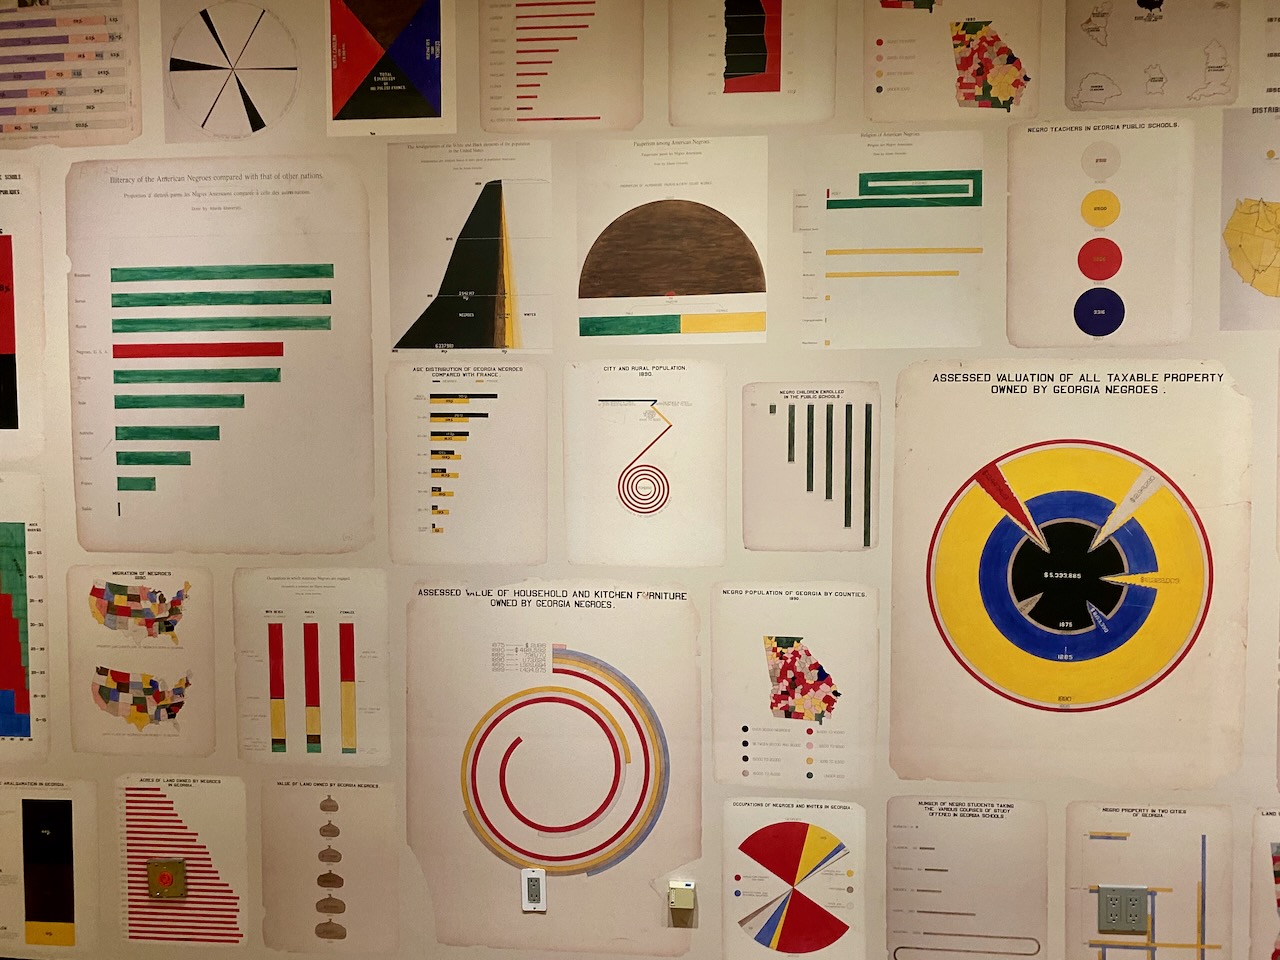
Without context, pie charts, bar graphs, scatterplots, histograms, and gauge charts are more like artwork than representative of data that informs their creation. The challenge to us is to present the graphs with accessible context. There is a story within each, an opportunity to take the viewer on a journey. How might we employ graphs to support our efforts and avoid confusing those looking for meaning?

